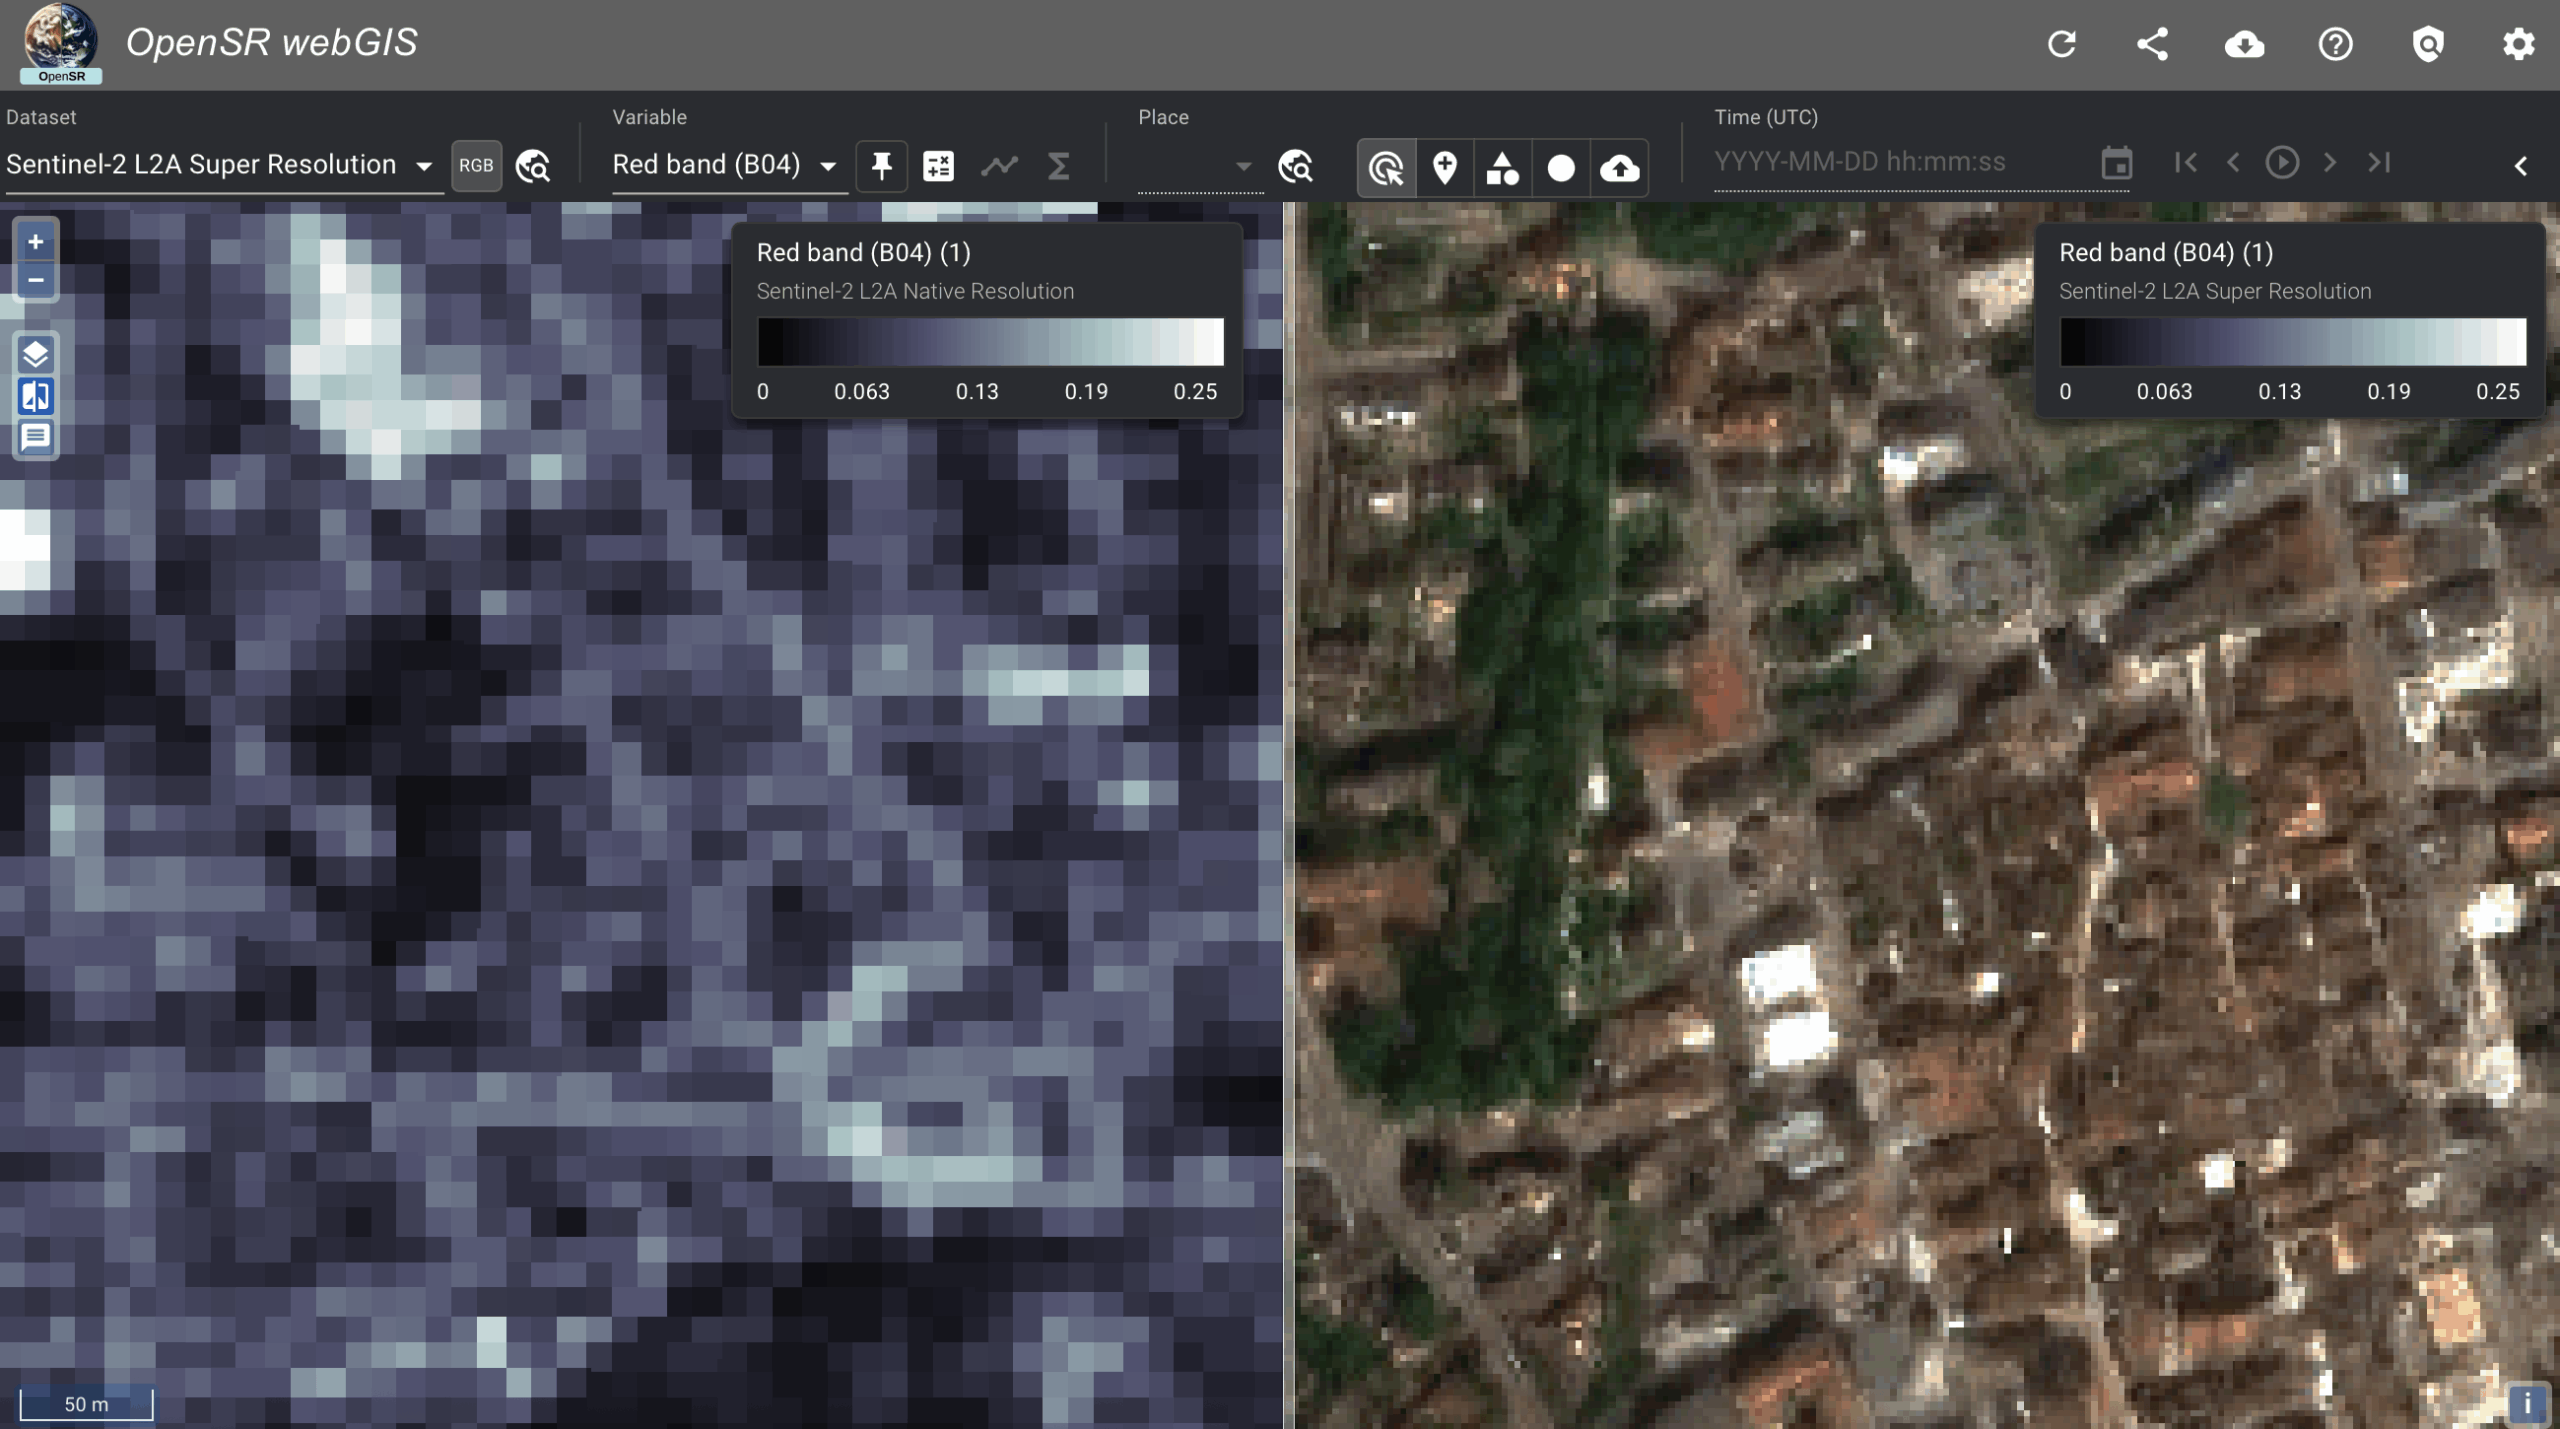
We’re excited to share the first release of the OpenSR WebGIS Viewer, now live displaying 1 million km²!
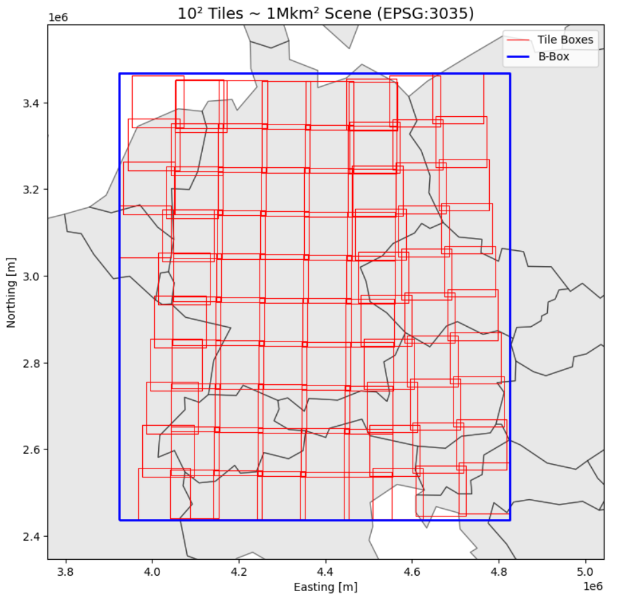
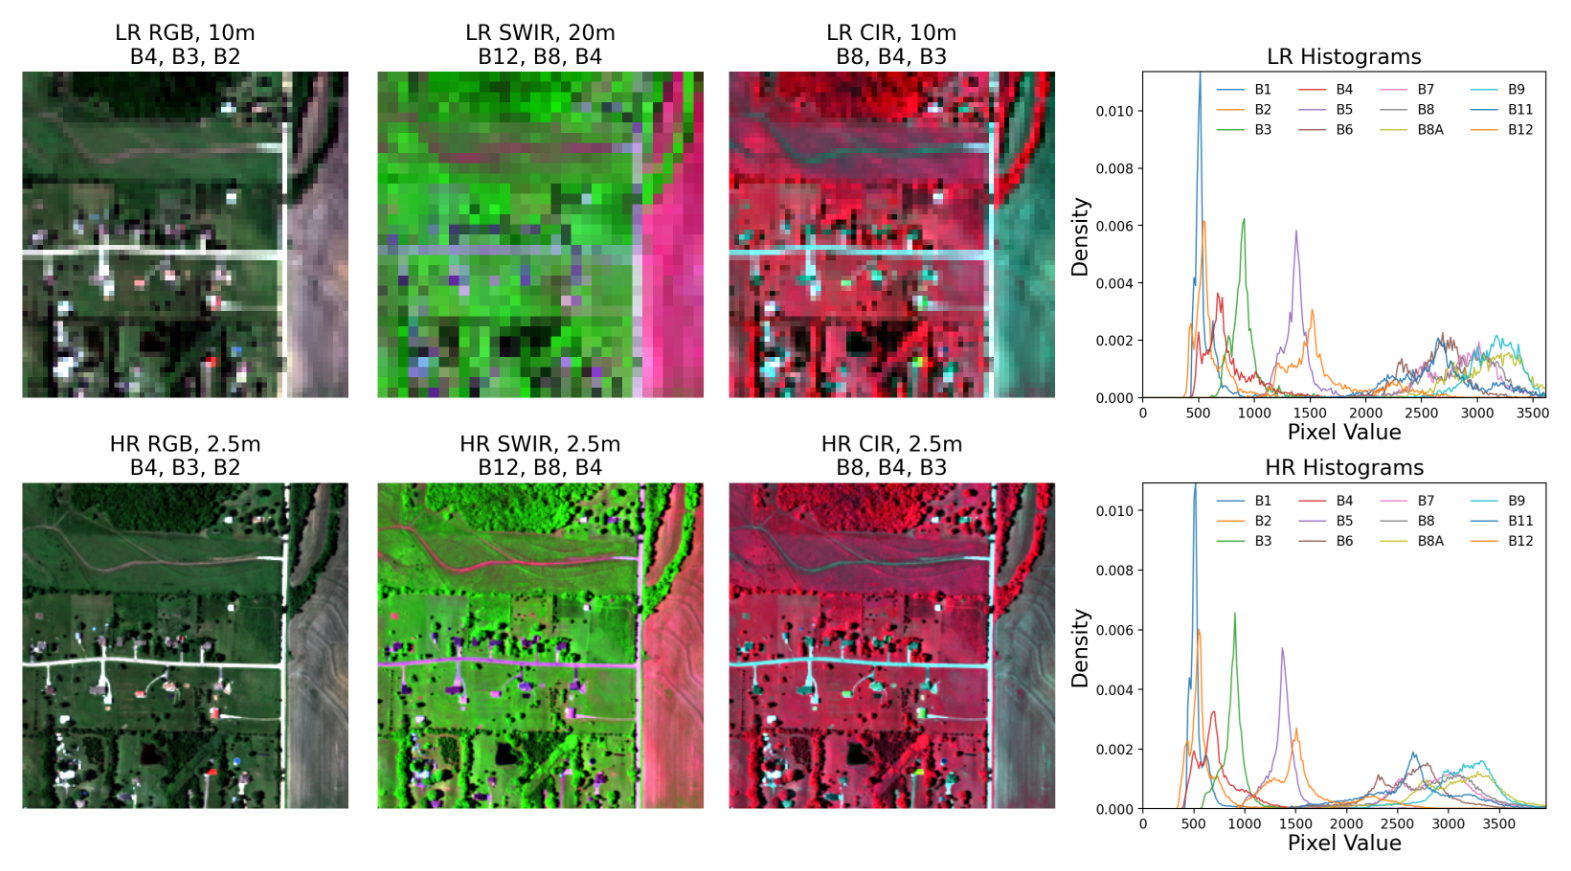
This viewer showcases one of our largest super-resolution experiments to date: a continental-scale spatial data cube generated from roughly 100 Sentinel-2 L2A tiles. These tiles include the 10 m S2 bands — red (B04), green (B03), blue (B02), and NIR (B08) — all processed through our AI-based model LDSR-S2 to reach 2.5 m spatial resolution.
How the cube was built
To create the data cube displayed in the viewer, we followed a three-step workflow:
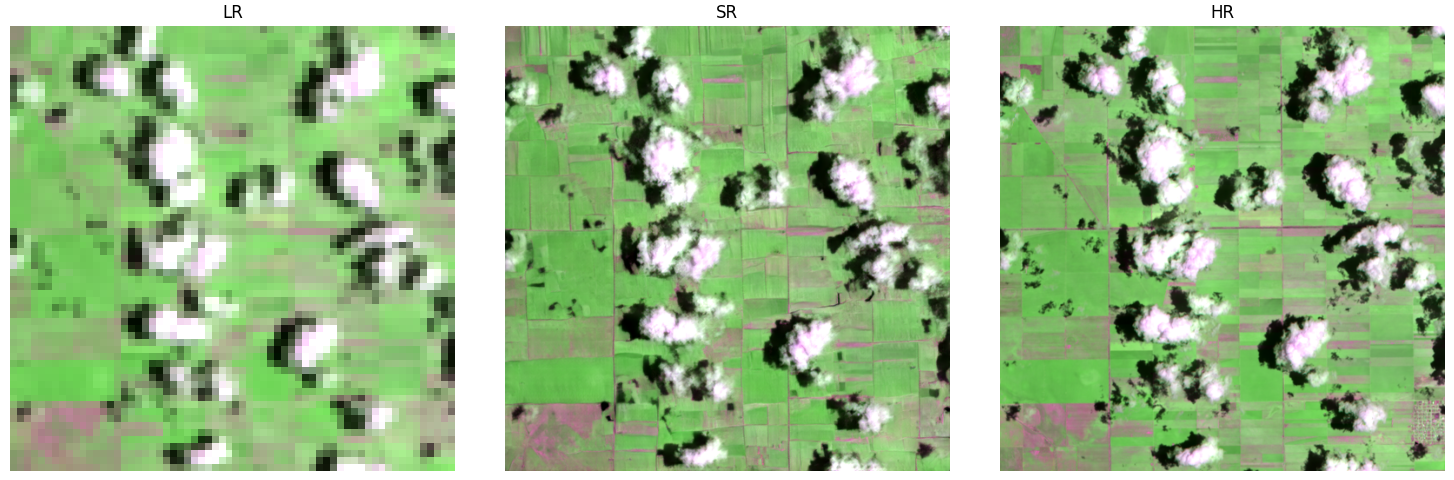
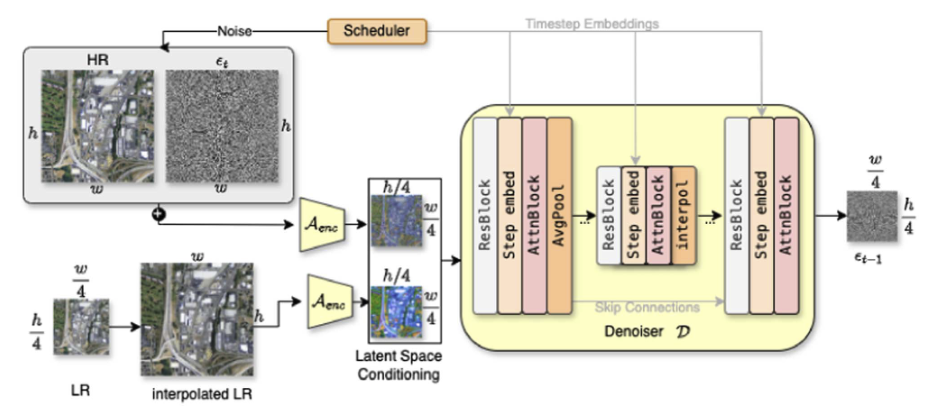
Super-resolution
Each Sentinel-2 L2A tile was upsampled from 10 m to 2.5 m using LDSR-S2, our latent-diffusion-based model designed for trustworthy enhancement of multispectral imagery.Reprojection
The super-resolved tiles were reprojected to the LAEA projection (EPSG:3035) using nearest-neighbour interpolation to ensure spectral consistency.Mosaicking into a unified cube
After reprojection, all tiles were stitched into one seamless spatial data cube, covering a large portion of Europe at a resolution far beyond native Sentinel-2.
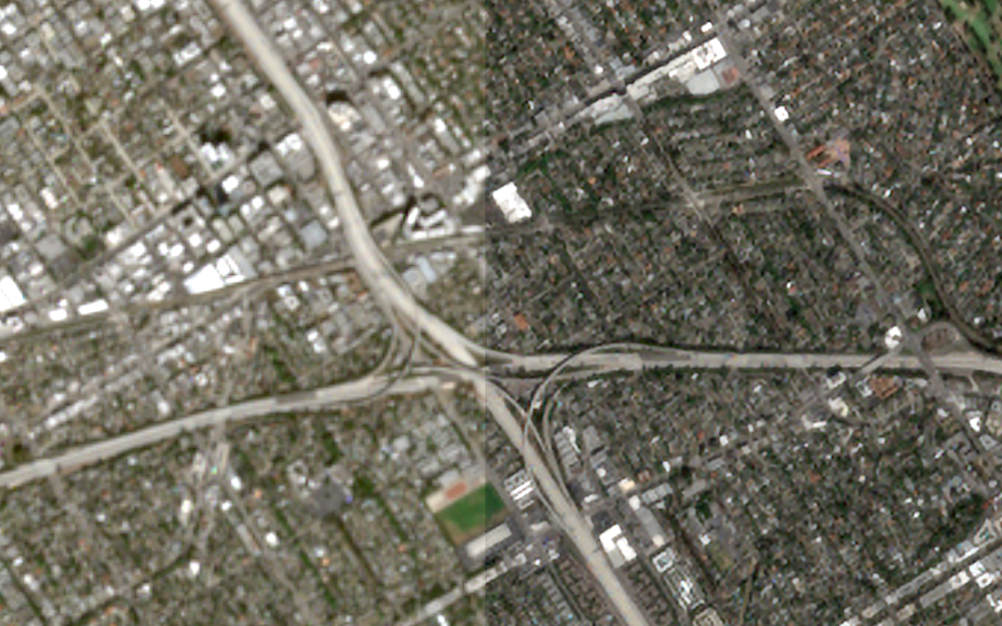
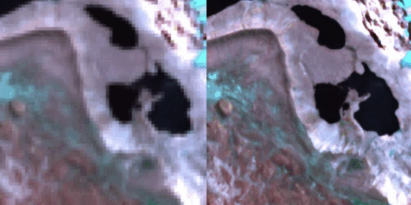
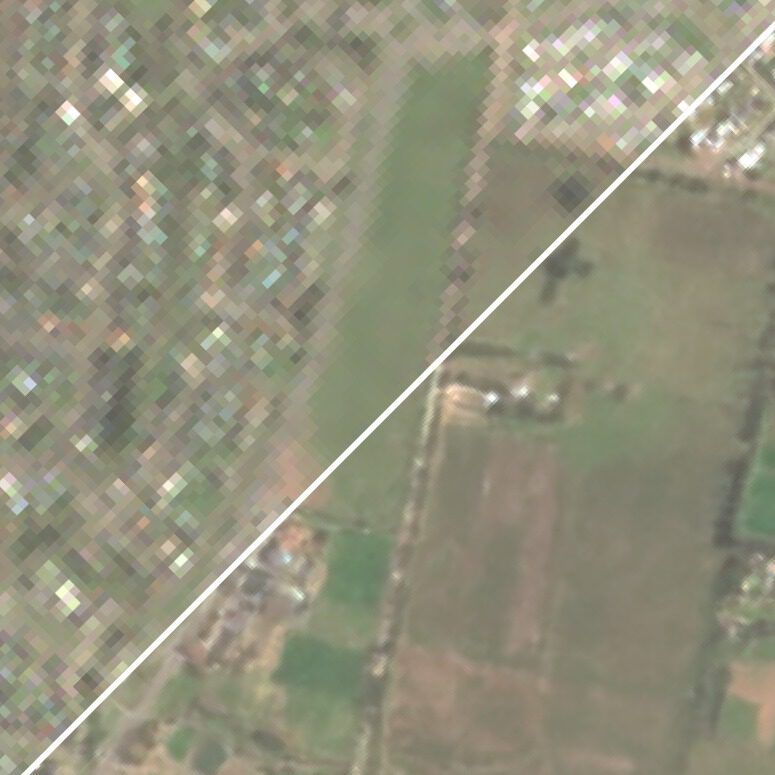
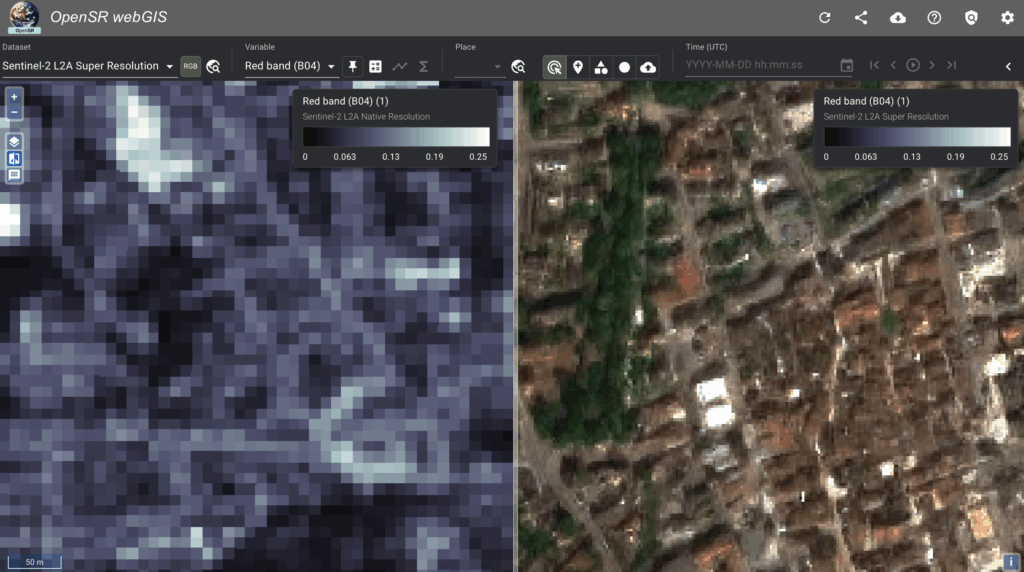
For comparison, the viewer also includes the Sentinel-2 L2A Native Resolution Cube, built from the exact same set of tiles. This allows users to visually inspect differences between native 10 m imagery and our AI-enhanced 2.5 m product.
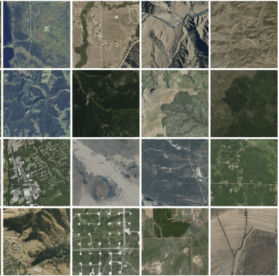
The source tiles used to build both cubes are illustrated in the accompanying figure within the viewer.